Basic Usage
Overview
Creating a new figure with figurefirst generally involves four steps:
- Design the layout file. Fundamentally this means decorating a specific subset of the objects in the svg files with xml tags that identify what objects are something figurefirst should expose to Python.
- Convert the information in the graphical svg objects into Python objects. This is accomplished via the
FigureLayoutclass. - Plot data, taking advantage of the objects created within the
FigureLayoutto style and organize the figure. - Merge newly created matplotlib figures with the original layout file and save to svg.
A multipanel figure
To get started it is worth examining how the figurefirst approach compares to generating a similar figure using matplotlib alone. Consider a five-panel figure with non-uniform axes sizes such as the example shown in the matplotlib gridspec documentation.
To generate this figure using only matplotlib and gridspec we would use the following code:
from matplotlib import pyplot as plt
ax1 = plt.subplot2grid((3, 3), (0, 0), colspan=3)
ax2 = plt.subplot2grid((3, 3), (1, 0), colspan=2)
ax3 = plt.subplot2grid((3, 3), (1, 2), rowspan=2)
ax4 = plt.subplot2grid((3, 3), (2, 0))
ax5 = plt.subplot2grid((3, 3), (2, 1))

Now if we want to plot data to any of these axes, we can direct our plotting commands to the appropriate axes, e.g.,
ax1.plot([1,2,3,4])
To construct a similar plot in figurefirst, we use Inkscape to create an svg layout document by drawing boxes where the five axes should lie, then tag these boxes with names, e.g., ax1, ax2, etc. To make the figure in Python, we then construct a FigureLayout object by passing the path to the layout document:
import figurefirst as fifi
layout = fifi.FigureLayout('/path/to/layout.svg', make_mplfigures=True)
figurefirst will construct the matplotlib figure and store the axes by their tag name in the ‘axes’ attribute of the layout object. For example, to plot on ax1:
layout.axes['ax1'].plot([1,2,3,4])
Designing a layout
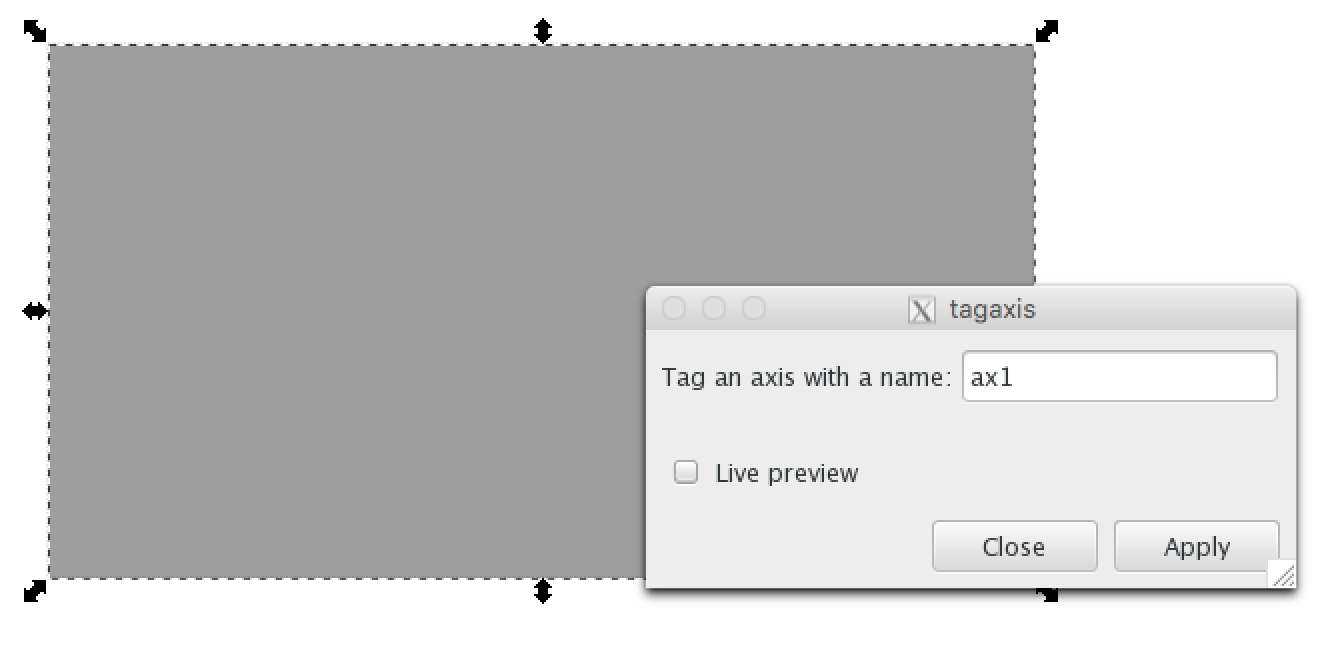
So how do you design a layout? The easiest approach is to use Inkscape and take advantage of the figurefirst extensions to tag the axes with unique names. We create a new document specifying the height and width of the figure in the document properties menu. Next we use the rectangle tool to draw boxes where we want our axis to appear within the figure. Finally, we give these axes names using the tagaxis extension. The screenshot below shows the tagaxis dialog box being used to tag a box with the name ‘ax1’.
Merging matplotlib plots back into the layout
Simply being able to use svg as a specification for axis placement is a useful feature on it’s own, but figurefirst allows you to take things one step further and direct the output of your plotting code back into the svg layout document. This means that any svg vector art that you include in your layout document can now be used as overlays and underlays to your matplotlib figures. To save our new plots we simply call
layout.save('/path/to/output_file.svg')
By default figurefirst will create a new svg layer to place all the new matplotlib artwork. Note that merging your newly plotted figures with the layout in this way also provides a mechanism for fast iterative development of your figures. If you save the plotted data back into the layout document (passing the original layout file as output_file), you can now make adjustments to the layout, add annotations, etc., now that you have a better idea of how the data lie within the figure. After making these changes, the plotting code can be re-run at any time to regenerate the plots without worrying about loosing these annotations.
By default, figurefirst will assume the layer called "Layer 1" is your template layer, and hide it.
To disable this, set hide_layers=[] in the constructor.
By preference, put non-template elements of your element on another layer.